GLARS Digital Surface Model Strips
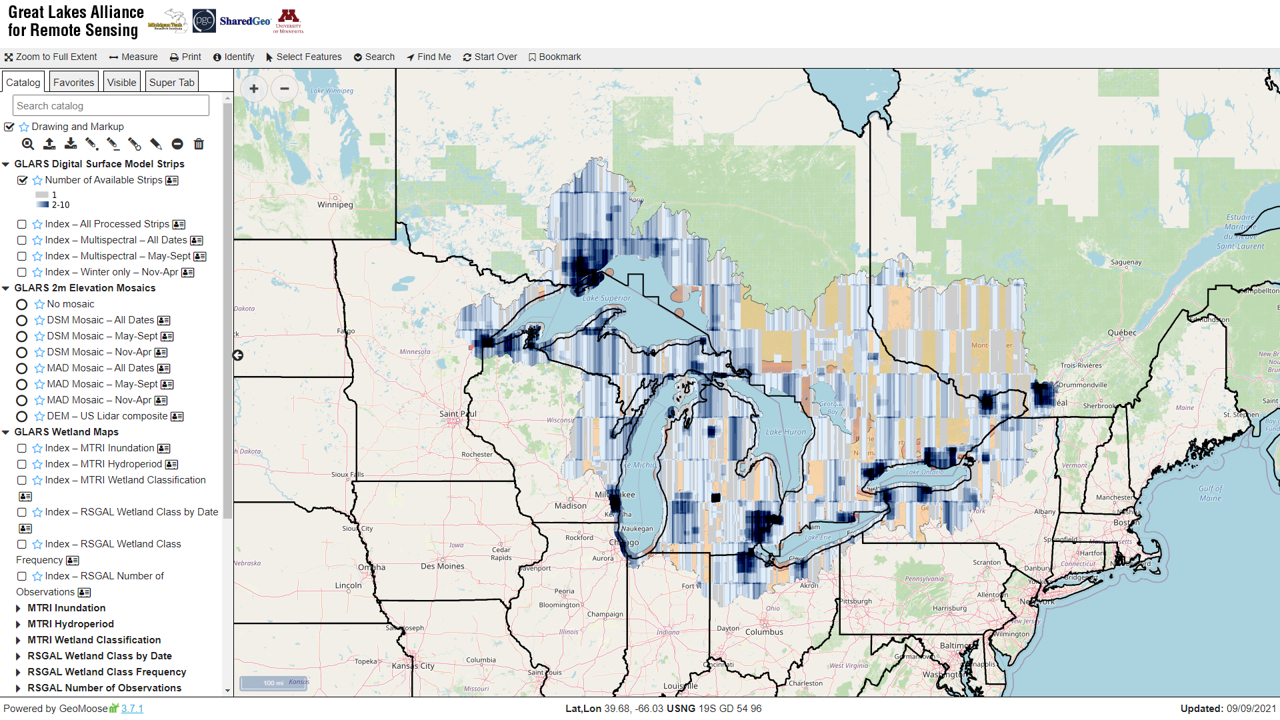
Number of Available Strips: Heatmap using showing the intensity of raw number of individual DSM strips available for download for a location.
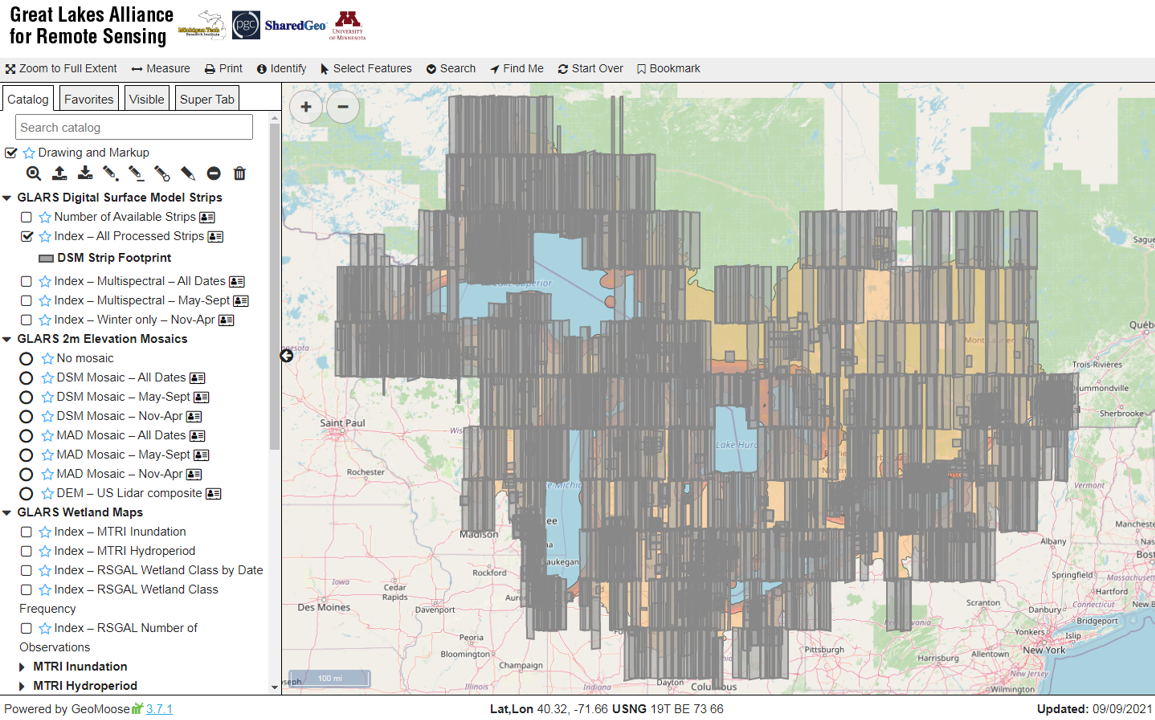
All Processed Strips: Index of all processed Digital Surface Model strips available, by date of imagery. Can be used to download data. Includes both panchromatic and multispectral imagery (see description of process and Instructions for Download, as well as Storymap)
Multispectral – All Dates: Index of Digital Surface Model strips, by date, all dates, including only those produced from multispectral imagery. The multispectral-based DSMs were found to be most useful for vegetation analysis.
Multispectral – May-Sept: Index of Digital Surface Model strips, by date, including May-September dates only (approximate growing season), produced from multispectral imagery. This is the primary DSM data source type used for RSGAL Object-Based Image Analysis wetland change detection maps (see below).
Winter only – Nov-Apr: Index of Digital Surface Model strips, by date, including November-April dates only (approximate leaf-off season), produced from either panchromatic or multispectral imagery. These DSMs could be used to approximate land surface, but may be influenced by snow depth.
GLARS 2 Meter Elevation Mosaics
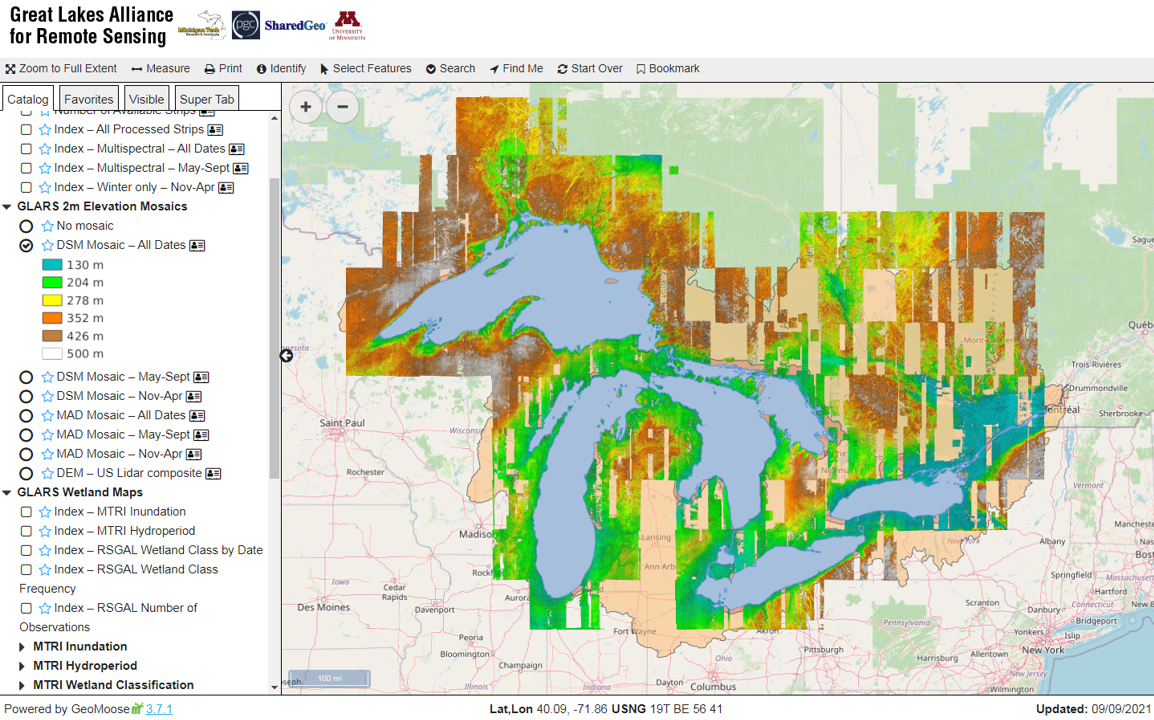
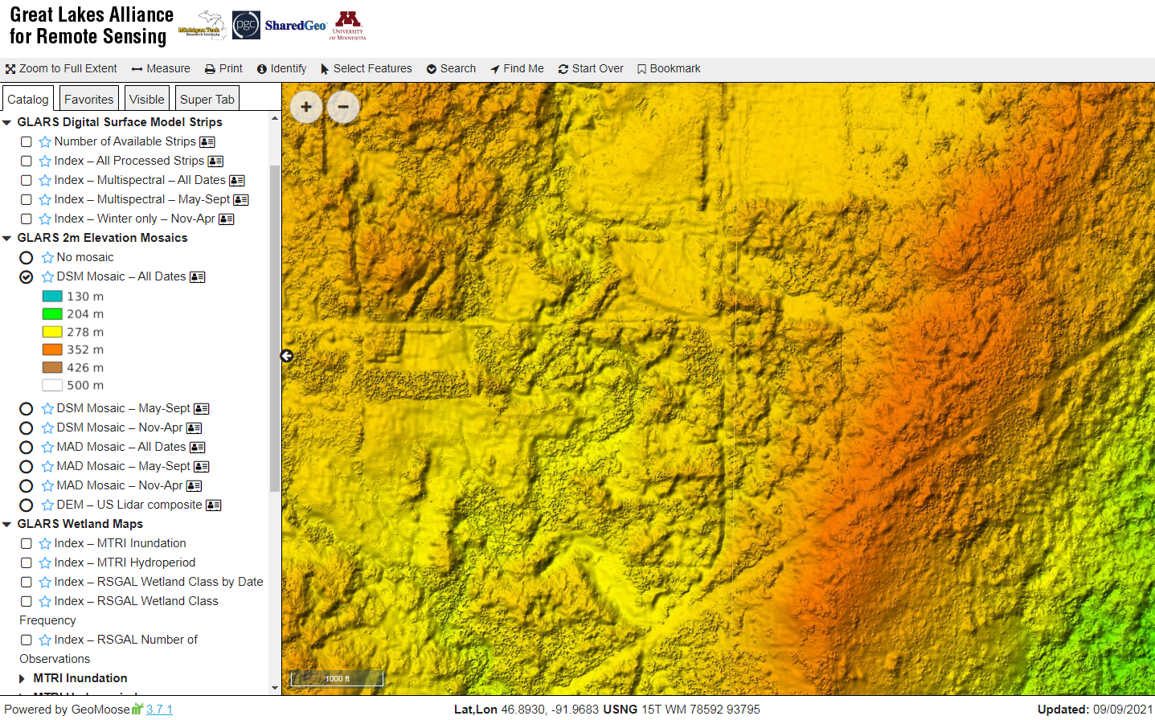
DSM Mosaic – All Dates: Digital Surface Model Mosaic value at each point is median elevation based on all dates available. Displayed on map as color visualization, actual values available through download. Derived from DSM strips from DigitalGlobe satellite imagery through SETSM stereo processing. Individual DSM strips were processed and combined to form mosaic. Because this includes all dates, it is the most comprehensive DSM mosaic, covering about 85% of the Great Lakes Basin (as of 2021). Note – these were made with a slightly different process from the current EarthDEM process. (For more info see description of process and Instructions for Download, as well as Storymap)
DSM Mosaic – May-Sept: (see above) Median elevation based on dates from May-Sept, all years. This can represent summer leaf-on surface elevation.
DSM Mosaic – Nov-April: (see above) Median elevation based on dates from Nov – April, all years. This can represent winter leaf-off surface elevation.
Click Image to Expand
Click Image to Expand
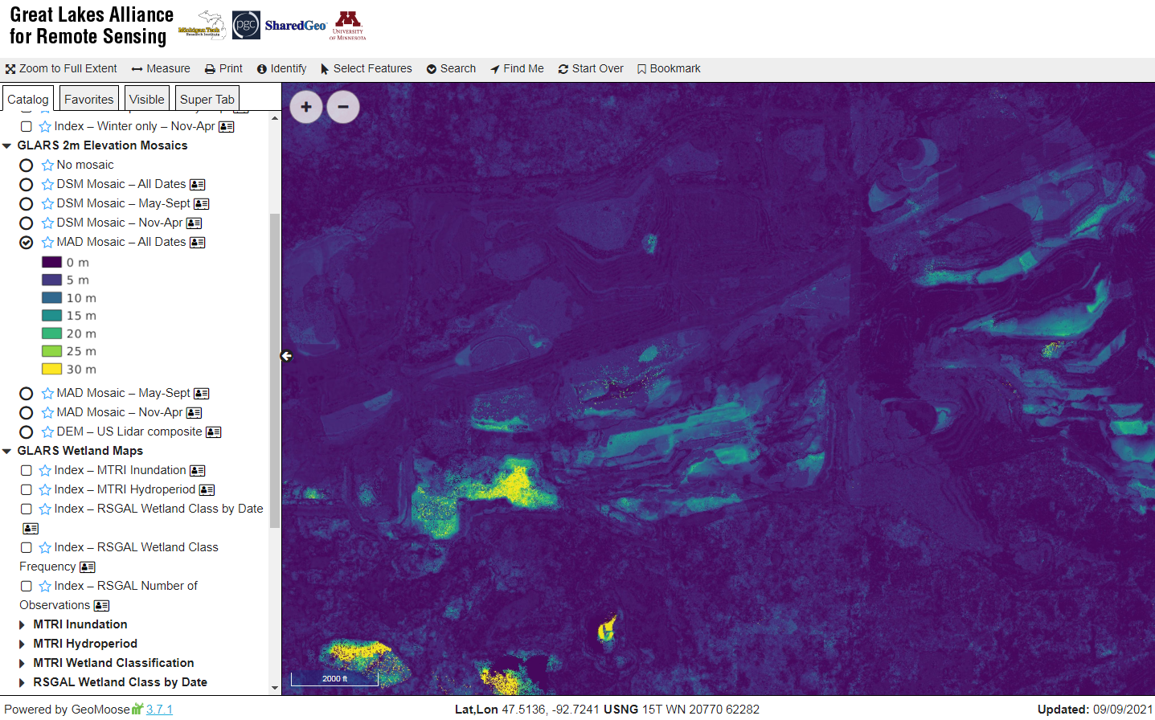
MAD Mosaic – All Dates: Median Absolute Deviation Mosaic value at each point indicates the variability in elevation values relative to All Dates DSM mosaic median values. Map shows color visualization, actual values available through download. MAD-Mosaic values can indicate areas of change seasonally or permanently, or areas of uncertainty in analysis such as open water.
MAD Mosaic – May-Sept: (see above) Value at each point indicates variability in elevation values relative to May – Sept DSM mosaic median values. This would indicate changes between summer seasons, and would not include summer vs winter changes (leaf on/off).
MAD Mosaic – Nov-April: (see above) Value at each point indicates variability in elevation values relative to Nov – April DSM mosaic median values. This would indicate changes between winter seasons.
DEM – U.S. Lidar Composite: Lidar files for U.S. side of Great Lakes Basin created by multiple state and local sources were found and acquired by RSGAL for use in the GLARS effort. SharedGeo staff standardized them into compatible point clouds, and assembled as a composite Digital Elevation Model. This represents ground elevations.
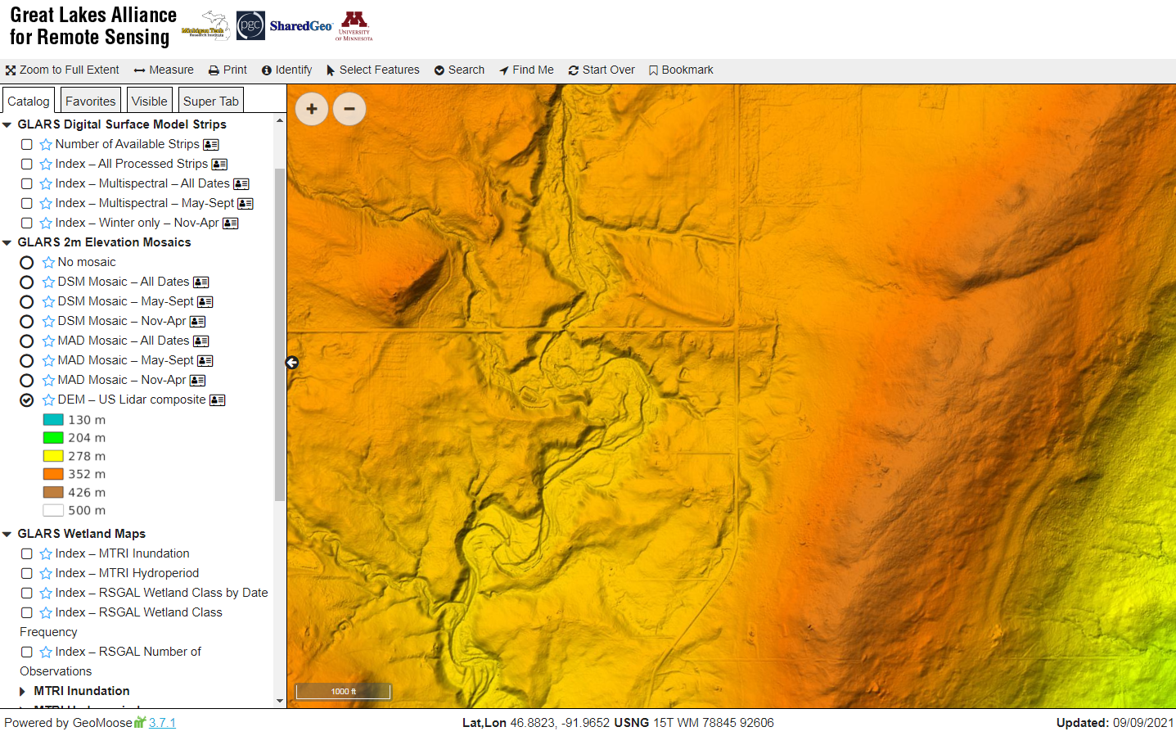
Great Lakes Alliance for Remote Sensing, using DSM(s) created by SharedGeo from DigitalGlobe, Inc. imagery.
GLARS Wetlands Maps
MTRI Inundation: Estimated inundation area, including both open water extent and flooded vegetation, at each of 10 study areas, for each date for which RADARSAT-2 data was available. The inundation area product has been automated and is produced nominally every 24 days with the repeat of the RADARSAT-2 satellite. These maps capture the dynamic nature of fluctuating lake levels. Created by MTRI. See Storymap.
MTRI Hydroperiod: A summary of inundation area data showing the frequency of inundation at 9 study areas, over the multiple dates for which RADARSAT -2 data was available. Created by MTRI.
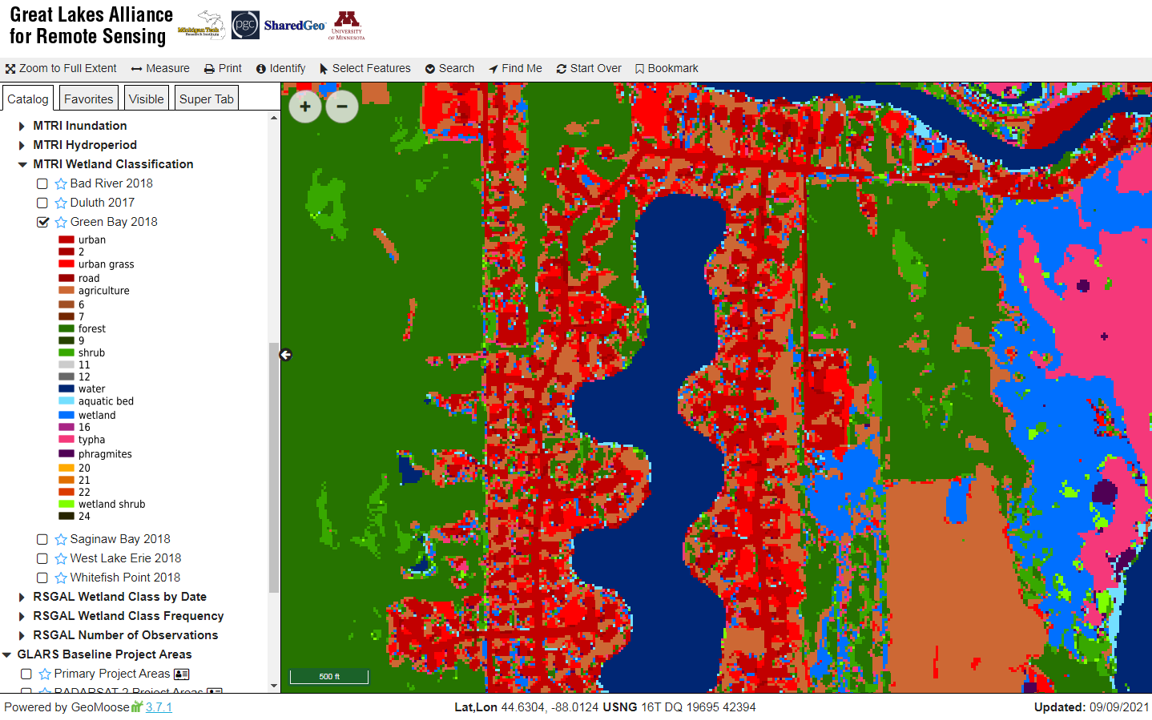
MTRI Wetland Classification: High resolution classified ecosystem type maps for six of the study areas based on 2017 or 2018 imagery. These classified maps have ~ 5 meter resolution and up to 24 classes, including a variety of wetland types. Overall these maps differentiate up to eleven different wetland types. Created by MTRI. See Storymap.
RSGAL Wetland Class by Date, Class Frequency, and Number of Observations: Wetland vegetation classification for the Great Lakes Coastal Wetland Inventory (GLCWI) derived from high-resolution, stereo satellite imagery and associated digital surface models (DSMs) and lidar-derived digital elevations models (DEMs) in an object-based image analysis (OBIA) workflow. The OBIA approach used the Cognition Network Language in eCognition Developer (Trimble Geospatial). The satellite imagery was acquired from DigitalGlobe under the NextView license. This approach integrated the multispectral imagery, DSMs, lidar-derived DEMs, and GLCWI polygons from the Great Lakes Coastal Wetland Consortium (2004 GLCWC Coastal Wetlands). The resulting classification created forested, shrub, and low vegetation classes using multiple height thresholds: Forested (> 2m), scrub/shrub (0.5m < 2m), and low vegetation (< 0.5m). The GLCWI polygons were used to summarize the vegetation classes in each polygon as forest, shrub, and emergent wetland classes, while the areal extent of each GLCWI polygon was used to summarize the area and percent cover for each class. Created by RSGAL
Three kinds of output included the following: Class by Date shows forest, shrub, and low vegetation plus non-vegetation areas for each individual date where a stereo pair was available. Class Frequency shows the % of times the pixel is in each vegetation class over the number of photo analyses dates available. Number of Observations shows how many stereo pairs were available that could be used to do the classification. See Storymap.
GLARS Baseline Project Areas
Primary Project Areas: There are 4 primary proof-of-concept sites where intensive Object-Based Image Analysis has been done using the Digital Surface Models, a ground Digital Elevation Model derived from Lidar, and other information from the DigitalGlobe satellite imagery. These include Duluth, Lake St. Claire, Long Point, and Bay of Quinte.
RADARSAT-2 Project Areas: The RADARSAT-2 Project Areas have additional remote radar data that is especially useful for detecting presence of water and water levels. MTRI has done extensive work with this data. (link to MTRI radar info)
Wetland Reference Datasets
2004 GLCWC Coastal Wetlands: Great Lakes coastal wetlands produced by the Great Lakes Coastal Wetland Consortium in 2004. Great Lakes coastal wetlands greater than 10 acres are included. Data provided by EPA here. Further information here. Full metadata here.
2010 MTRI Coastal Wetlands: Comprehensive wetland delineation of the bi-national coastal Great Lakes which includes adjacent land use and at least two invasive plant species: Typha spp. and Phragmites australis. Mid resolution product produced by MTRI. Direct access here.
2010 MTRI Michigan Connected Wetlands: Made from 2010 Coastal Wetlands, mid resolution. Michigan is done, other states are in progress.
2017 Battelle Coastal Wetlands: This dataset was developed for EPA by Battelle to identify Great Lakes coastal wetland regions (i.e., wetland areas that have a high likelihood of having current, previous or potential hydrologic connection to a Great Lake or connecting channel via surface or possibly subsurface water) covering the entire US and Canadian Great Lakes coastline. It is the result of a semi-automated approach integrating satellite-based vegetation classifications created for GLRI, digital elevation models and supplemental data. This approach results in the classification of each wetland region into a coastal wetland likelihood class, only the highest of which is displayed. Data provided by EPA, for each Great Lake here.
2009-2014 NWI – Minnesota Update National Wetlands Inventory data from the most recent update in Minnesota as provided here.
Most Recent NWI – USFWS (> 1:250000): National Wetlands Inventory data from the US Fish & Wildlife Service. High detail for viewing at close zoom. Information varies by state with most recent data available from web map service.
Most Recent NWI – USFWS (< 1:250000): National Wetlands Inventory data from the US Fish & Wildlife Service, generalized for viewing when zoomed out. Information varies by state with most recent data available from web map service.
Boundaries
Canada Provinces: Unlabeled outline map of Canadian province boundaries.
U.S. Congressional Districts: Unlabeled outline map of U.S. congressional district boundaries.
U.S. Counties: Unlabeled outline map of U.S. county boundaries.
U.S. States: Unlabeled outline map of U.S. state boundaries.
Basemaps
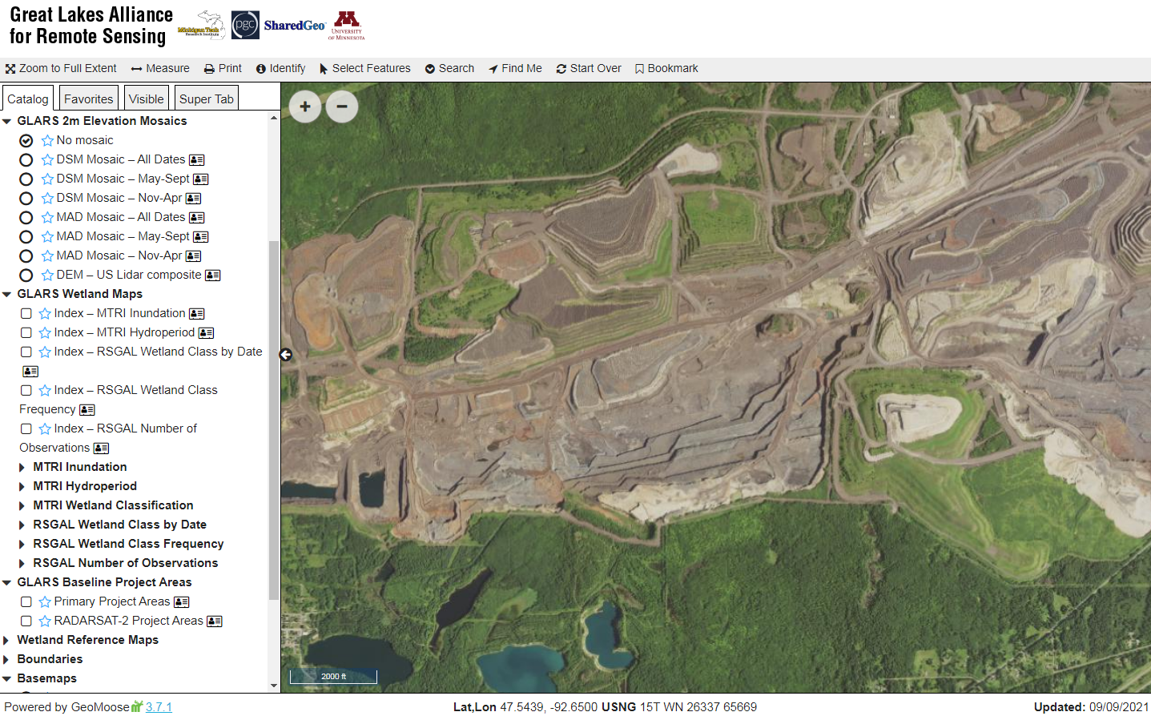
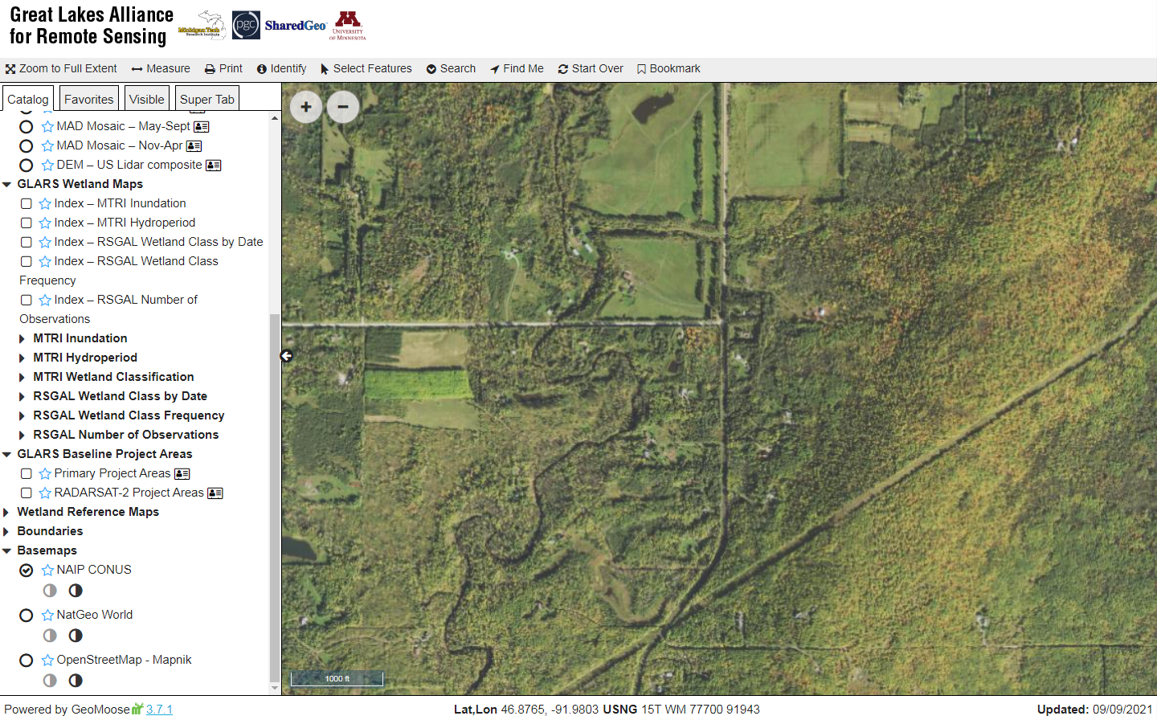
NAIP CONUS: Aerial imagery as collected and stitched by the U.S. Department of Agriculture, Farm Service Agency’s National Agriculture Imagery Program (NAIP) over the Continental United States (CONUS).
NatGeo World: ESRI developed National Geographic style map for the world. Details here.
OpenStreetMap – Mapnik: Rendering of the © OpenStreetMap Contributors base map using the Mapnik tool kit.