GLRI Phase III Focus Areas
Find below some examples of how GLARS products can be used by conservationists and researchers to support the GLRI Phase III Focus Areas. In addition to the Focus Areas as applied to restoration of Great Lakes coastal wetlands, products and data that can be downloaded from this website are of benefit to a broad swath of other GLRI projects. Please see the list at the bottom of the page for some other potential uses.
Products Which Support GLRI Phase III Focus Area 2: Invasive Species
MTRI Wetland Classification Map
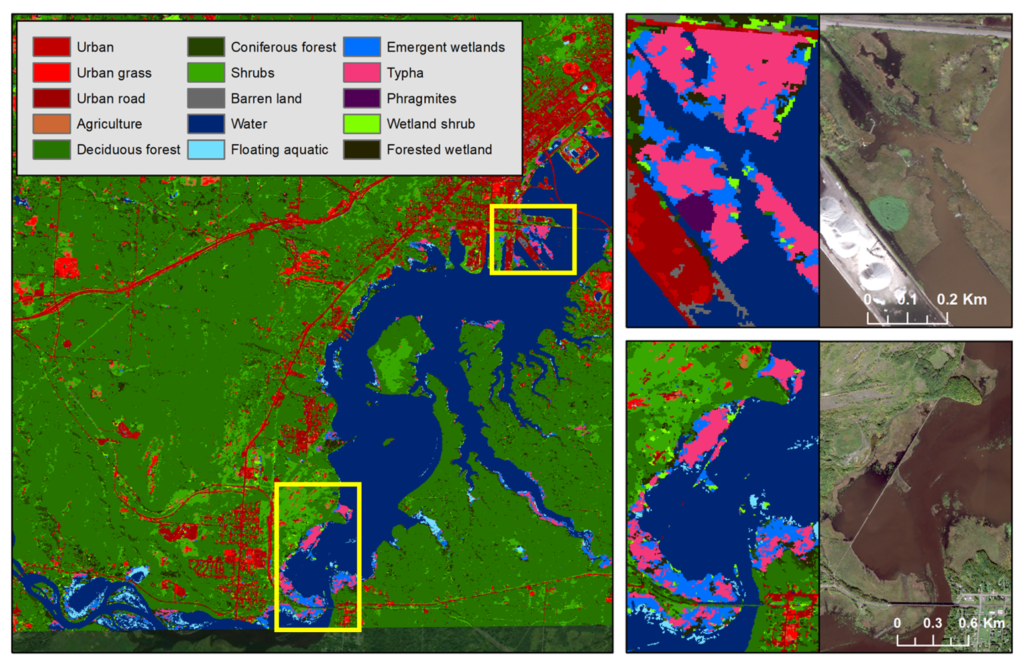
Species level wetland type maps allow Great Lakes natural resource managers to track the spread of invasive species such as Phragmites australis and cattail (Typha angustifolia and Typha x glauca) as well as quantify the efficacy of their treatment. GLARS partners have worked with managers in the Saginaw Bay, Michigan since 2016 to map, target and treat invasive species Phragmites australis with herbicide treatment. Comparing classifications from multiple years has enabled identification of standing dead Phragmites from the remaining live vegetation and target follow up treatments. In addition, separation of 3-4m high Phragmites australis from 2m high cattails has been made possible by incorporating GLARS Digital Surface Model data into the traditional classifications, thus further improving accuracy of maps and efficiency of eradication.
GLRI Phase III Focus Area 2 Commitments Support:
- 2.1: Conduct early detection and surveillance activities.
- 2.3: Conduct field testing of innovative control technologies and methods to prevent the introduction and to control the spread of invasive species.
Some potential uses of this product:
- Identify and quantify the extent of invasive species.
- Monitor effectiveness of eradication procedures.
- Use height measurements of competing invasive plants to aid in location determination and eradication.
References: Michigan Phragmites Management
Products Which Support GLRI Phase III Focus Area 3: Nonpoint Source Pollution Impacts on Nearshore Health
SharedGeo Digital Surface Model (DSM) Strips and Mosaics
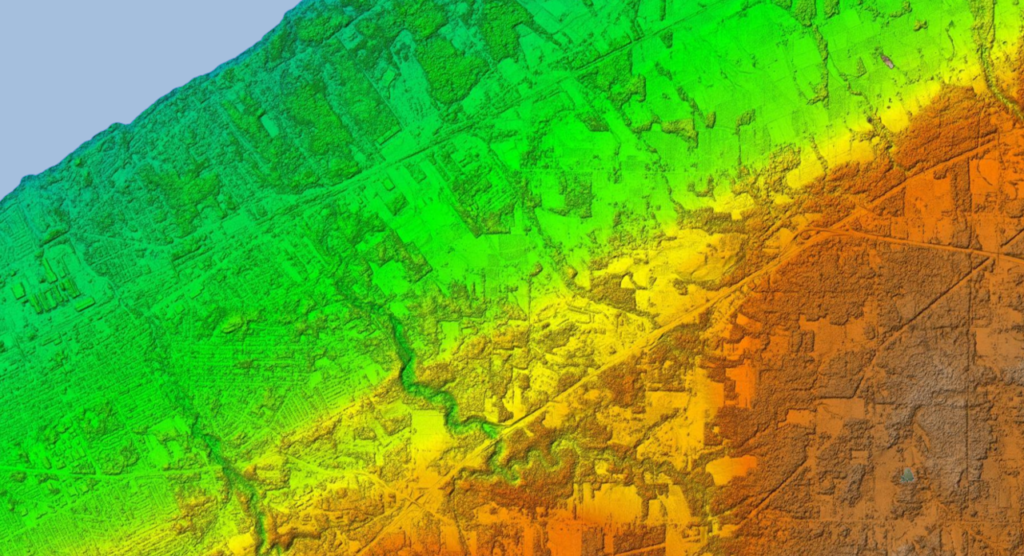
On Zoom In, 3D Elevation has a 2-Meter Resolution.
Great Lakes Alliance for Remote Sensing, DSM created by SharedGeo from DigitalGlobe, Inc. imagery.
Covering 85% of the entire Great Lakes Basin, Digital Surface Model (DSM) products – strips and mosaics at 2-meter resolution – allow conservationists and researchers to identify man-made and natural changes in localized landscape elevation in an accurately measurable way over time. In addition to serving as a baseline reference for other analyses, this product supports boots-on-the-ground visualization needs and basin-wide change detection.
GLRI Phase III Focus Area 3 Commitments Support:
- 3.2: Implement watershed management projects in urban and rural communities to reduce runoff and erosion.
- 3.3: Evaluate effectiveness of nonpoint source projects.
- 3.3: Develop new or improved approaches for reducing or preventing harmful algal blooms.
Some potential uses of this product:
- Locate unusual areas of upland elevation change which could infer genesis of nonpoint pollution from inappropriate use of farmland or other man-made activities.
- Find areas of canopy height change caused by factors such as tree harvest or death by invasive species. This information can then be used to track areas which may require further investigation and/or remediation before serious erosion problems develop.
- By viewing elevation change over time, identify eroding Great Lakes shorelines which are contributing to sediment plumes.
- Map urban expansion through 3D infrastructure changes tied to nearshore land use impact models
References: Although there are some minor adjustments in the processing algorithm, GLARS DSMs were produced using essentially the same process as the ArcticDEM product produced by Polar Geospatial Center (PGC). ArcticDEM is the official U.S. Government elevation model for researchers working in the earth’s arctic regions (north or south of 60 degrees latitude), and Canada has adopted ArcticDEM as its national elevation standard.
Products Which Support GLRI Phase III Focus Area 4: Habitats and Species
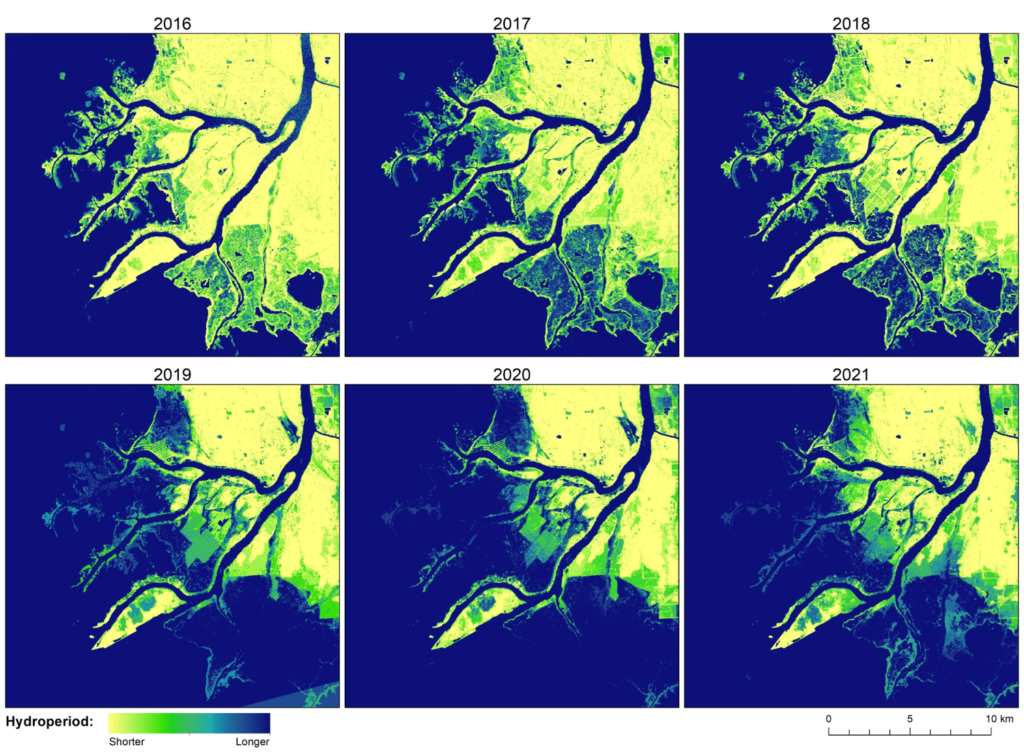
MTRI Inundation and Hydroperiod Maps
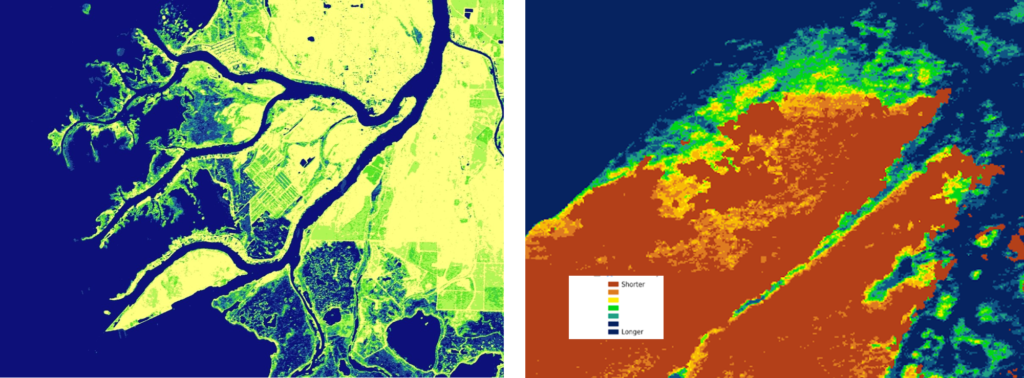
The intensity and orientation of the returning synthetic aperture radar (SAR) signals in an image convey information about vegetation, water and moisture levels in the ground. This can be used to differentiate which changes in a region are flooded vegetation vs. non-flooded vegetation and which areas are water vs. non-water. High repeat radar sensors, such as RADARSAT-2 used for this effort capture imagery on a 24-day cycle. This enables comparison of changes in inundation and water extent over time. This information can be critical to understand habitat vulnerabilities, such as the changes in the emergent vegetation nesting grounds of the threatened black tern (Chlidonias niger) in the St. Clair River Delta as pictured in the left frame above. Immediately below, see an example of how this type of GLARS product provides meaningful understanding through visualization applied over time. As the area of blue expands, critical habitat coastal wetlands are slipping below the waves.
MTRI Wetland Classification Maps and RSGAL Simplified Wetland Class by Date Maps
Optical-IR imagery can be used to identify land cover types using vegetation reflectance which varies depending on features at the cellular level (e.g. chlorophyll, leaf moisture) and background reflectance which depends on surface (e.g., soil type, water). Synthetic aperture radar (SAR) imagery can differentiate wetland types based on inundation/water level patterns, vertical structure, soil moisture and biomass. Wetland maps can then be automatically created using a combination of multi-season optical and radar sate
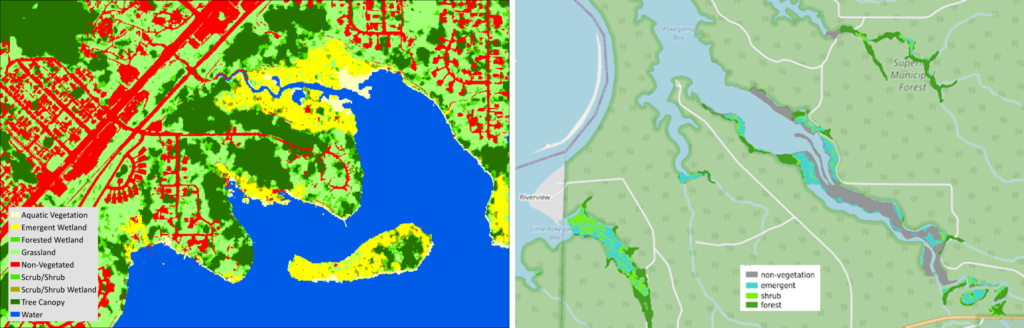
Wetland maps can then be automatically created using a combination of multi-season optical and radar satellite imagery and Digital Surface Models for key study areas around the Great Lakes. The resultant map products provide a way to quantify wetland/habitat gain and loss over time; not just year to year, but month to month.
GLRI Phase III Focus Area 4 Commitments Support:
- 4.1: Identify habitats that support important Great Lakes species and take actions to restore, protect, enhance, and/or provide connectivity for these habitats.
- 4.2: Update and implement recovery actions for federal threatened, endangered, and candidate species.
- 4.2: Support population-level protections, enhancements, and re‑introductions for state, tribal, and Great Lakes native species of importance.
Some potential uses of this product:
- Definitive identification of critical habitat for endangered species
- Replacement of outdated National Wetland Inventory Maps
- More accurate wetland determinations
- Management of wild rice restoration activities
- Avoiding habitat loss through improving road transportation building and repairs through more accurate wetland mapping
- Identifying potential wetland restoration and banking sites
References:
- Collapse of a Black Tern (Chlidonias niger) Colony as a Result of Climate Change Driven Lake-Level Extremes and Anthropogenic Habitat Alteration
- Using SAR to Characterize Black Tern Nesting Habitat and Survival in Response to Record Lake Level Rise. Mr. Michael Battaglia, Ms. Jennifer Fuller, Dr. Laura BourgeauChavez, Mr. Andrew Poley, Mr. Brian Huberty. Canadian Remote Sensing Society, 2021 Annual Conference, Virtual
Support of GLRI Phase III Focus Area 5: Foundations for Future Restoration Actions
Great Lakes Alliance for Remote Sensing (GLARS)
The Great Lakes Alliance for Remote Sensing (GLARS) is the first bi-national collaborative effort where environmentally focused remote sensing products of six bi-national organizations have been made publicly available for the restoration of the Great Lakes; the planet’s largest surface freshwater system. The alliance is a model of cooperation, research, and science which has created a foundation for a Geospatial Infrastructure for the Great Lakes while maximizing the benefit of tax-payer dollars spent and amplifying the value of products delivered to conservationists, researchers and the general public.
GLRI Phase III Focus Area 5 Commitments Support:
- 5.2: Identify cross-cutting science priorities and implement projects to address those priorities.
Some potential developments going forward:
- Bring other research organizations into the alliance
- Expand current product line in time sequence so that it provides clear understanding of climate change over the entire Great Lakes
- Expand current product line in geographic coverage to all parts of the Great Lakes Basin
GLARS Products Potential Other Uses

Beyond the examples shown above in the GLRI Phase III Focus Areas section, find below some other ways in which GLARS data and products can be combined or used individually to support GLRI and other Great Lakes restoration activities.
- Blue Accounting initiative
- Resilient lands and waters identification
- Climate change and carbon analysis impact assessment
- Forest restoration planning
- Streambank erosion monitoring
- Wildland fire potential through canopy analysis
- Basin-wide understanding of invasive species remediation efforts
- Quantifying wetland gain and loss
- Wetland types/extent determination
- Coastal erosion monitoring
- Coastal flood inundation tracking
- Culvert inventory and watershed modeling
- Community climate resiliency efforts
- Habitat assessment
- National Wetland Inventory (NWI) updating
- Hydrography analysis and mapping
- Wild rice mapping and assessment
- Invasive species mapping and assessment/analysis
- Watershed assessment and planning
- Flood mitigation analysis and mapping
- Cliff erosion analysis
- Open lands assessment
- Water level change tracking
- Wetland protection and habitat restoration
- Public access and historic preservation activities
- Development of regional elevation models
- Surface water/inundation extent models