Understanding the Basics of Stereoscopic Satellite Imagery
Collection Mode
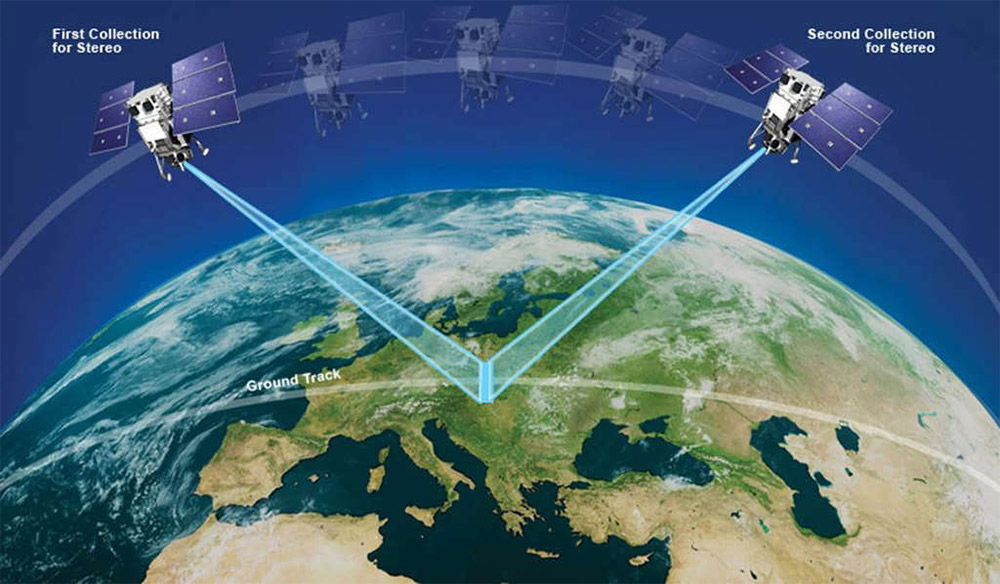
Stereoscopic imagery collection mode refers to when the satellite sensor acquires two images of the same location taken from different angles.
In the case of the DigitalGlobe stereoscopic imagery used in the GLARS team, the images are taken by the same satellite about 45-90 seconds apart.
The satellite takes a shot of the location of interest, then continues traveling along its orbit for a short time, then rotates the camera to point back towards the same location to collect the second image. This is called in-track stereo.
A stereoscopic pair can also be acquired in cross-track stereo mode when the satellite completes at least one orbit between the two image collections.
In-track stereo is more valuable because less will have changed in the target location between the two shots.
All DigitalGlobe satellites can collect imagery in stereoscopic mode. However, due to sensor model uncertainty, the best Digital Elevation Models (DEM) are created from stereoscopic imagery collected by WorldView-1, WorldView-2, and WorldView-3.
Source: DigitalGlobe.
2D to 3D
Using photogrammetric techniques, a pair of imagery shots collected in stereo mode can produce a 3D elevation model of the area.
DEM extraction algorithms first perform a method of image matching on the two images in the stereoscopic pair to identify homologous features in both images.
Instead of matching just a few distinctive features, the algorithms attempt to match each pixel with its corresponding pixel from the other image. Because of the slightly different collection geometry and the resulting distortion, any two homologous points on a pair of images will be in slightly different places.
The DEM extraction algorithms use the disparity between the two point locations in combination with the image collection geometry to determine the exact distance from that point to the satellite.
Because the position of the satellite is also precisely known, the the algorithm can calculate the point’s exact horizontal (x,y) and vertical (z) location.
This process of converting matched pixels into geographic coordinates is then calculated over the entire extent of the image pair.
Next, the algorithm interpolates a surface to match the point cloud (collection of matched points), divides the resulting surface into an regularly spaced grid, and writes the output as a raster (gridded) DEM.
The resulting DEM is referred to as a stereo-derived elevation model.
There are two sub-types of DEMs:
- Digital Surface Model (DSM) – A 3D rendering of a location which uses the elevation of any object standing above the terrain surface. Examples would include trees and structures. If the ground is bare, then the height value is the elevation of the terrain. The term Digital Surface Model (DSM) as used on this website refers to “strips” of processed data. Digital Surface Model – Mosaic (DSM-M) is used to denote products which have stitched together strips to create a contiguous view over a region.
- Digital Terrain Model (DTM) – A 3D rendering of a location which only uses the elevation of the terrain. Objects standing above the terrain like trees and structures are ignored.
GLARS DSM Products
SharedGeo provides stereo-derived elevation models products at 2 meters per pixel resolution for the GLARS project.
Both DSM strip and mosaic products are available.
DSM Strips
The most common GLARS DEM product is the DSM strip, which is the result of running elevation extraction on a set of images all taken in sequence. The strips are 15-17 km wide and 15-100 km long (i.e. the same extent as the source imagery pairs).
A key attribute of the strips is that they have a specific timestamp. Their source images were all collected within a short period, and the strip DSM reflects the state of the terrain at that time.
Another DSM strip taken a year later over the same location would show if there had been any significant elevation changes in the area in the intervening time.
DSM Mosaics
SharedGeo also releases mosaics of the DSM strips. These products cover a larger area, but no longer preserve the unique timestamped nature of the strips.
A mosaic might be made from source DSMs spanning five years, for example.
In order to avoid abrupt discontinuities in elevation values, the source DSMs are co-registered and the edges are blended to create the effect of a single, continuous elevation model.
Some information on this web page courtesy of the Polar Geospatial Center.